Annual Water Yield
~ 1.19hundred million t/yr
119,115,675 m³/yr (±30% CI: 83 M – 155 M tonnes)
Equivalent to the annual domestic water demand of ~1.6 million households.
1. Summary
The AOI around Himi City (16 km × 14 km, 22,400 ha total) contains 12,398 ha of forest (55.3%) as identified from Sentinel-2 imagery. The portion of annual precipitation that this forest captures and supplies downstream as groundwater / baseflow — i.e. water yield — is estimated at approximately 119 million tonnes/year (961 mm/yr).
Annual precipitation
2,331mm/yr
NASA POWER 2020-2024 mean
Water yield
961mm/yr (41.2%)
Forest area only
Evapotranspiration
837mm/yr (35.9%)
Transpiration + canopy interception
2. AOI and Sentinel-2 NDVI observation
Study area
Himi City, Toyama · Sea of Japan high-rainfall coast
Sentinel-2 NDVI (2026-03-17)
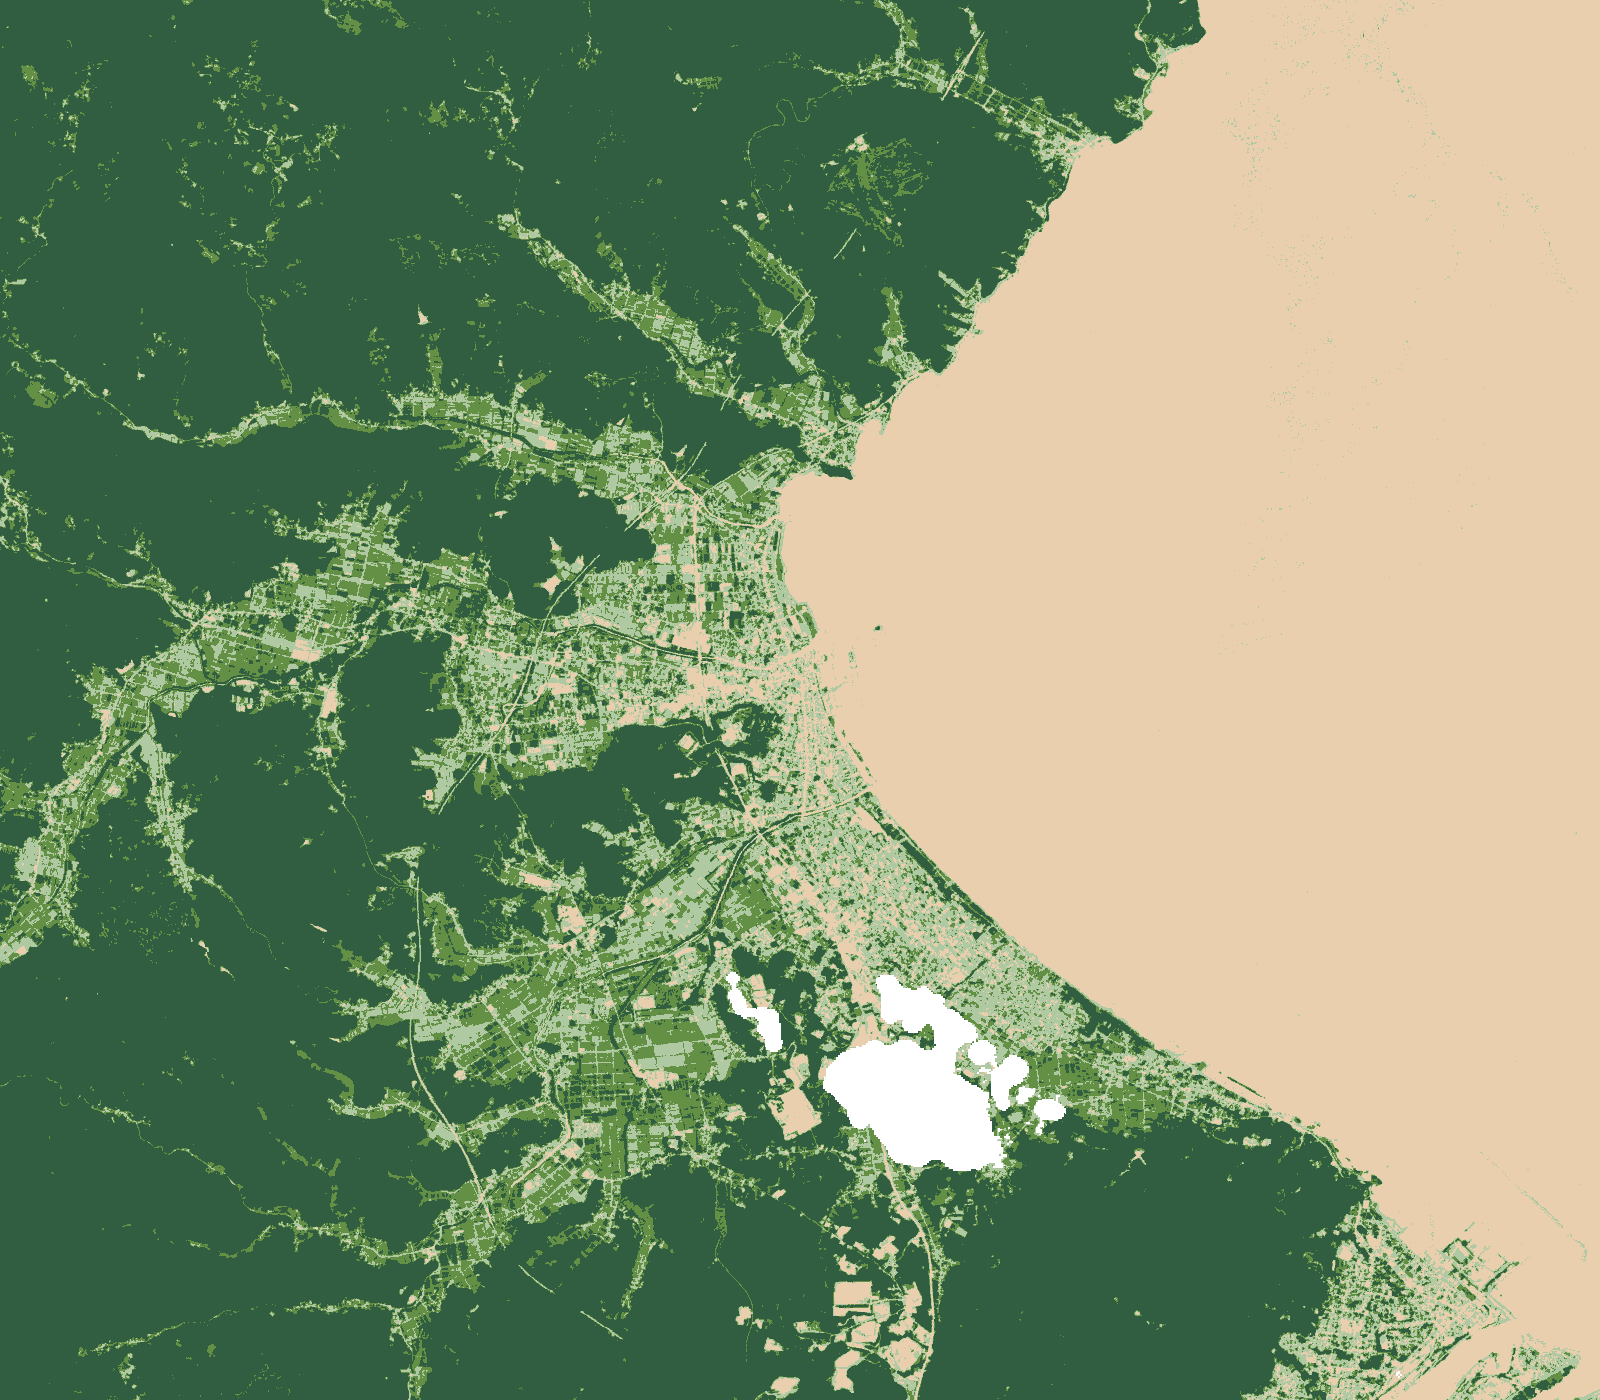
Dark green = high NDVI (active vegetation) · light green = mid · brown = bare / low
Cloud cover 3.7%, Sentinel-2A observation
3. Water-balance breakdown
Where the 2,331 mm of annual precipitation goes
3.1 5-year NDVI time series (real observations)
5 years of Sentinel-2 observations (71 sample points) aggregated via the CDSE Statistical API. The seasonal cycle (spring–summer peak, winter decline) and inter-annual variability are clearly resolved. We applied an NDVI threshold of 0.5 to summer-peak rasters to identify forest area.
4. Calculation method (IPCC-aligned, Forestry-Agency compliant)
Aligned with the "Simplified Evaluation Method for Forest Water Yield Ver.1.0" published by the Forestry Agency of Japan in March 2026. Every input is fetched automatically from public open data sources.
4.1 The headline equations
4.2 Inputs and sources
| Input | Value | Source |
|---|---|---|
| Monthly T & P | T=16.0°C, P=2,160 mm/yr | NASA POWER monthly (2020-2024 mean) |
| Station elevation | 2.9 m | GSI Japan 5 m DEM API |
| Forest-point elevation | 171.5 m | GSI Japan 5 m DEM API |
| Geology class | Tertiary (Neogene Miocene) | AIST Seamless Geological Map v2 API |
| Forest type | Evergreen conifer (sugi / hinoki dominant) | Sentinel-2 NDVI seasonal pattern |
| Forest area | 12,398 ha | Sentinel-2 L2A NDVI > 0.5 (Hansen 2013) |
| Stem density | 783 stems/ha | Forestry Agency default (mid-aged sugi/hinoki) |
| Mean DBH | 32 cm | Forestry Agency yield-prediction table (age 50–70) |
| Mean tree height | 18 m | Same as above |
4.3 Results (mm/yr scale)
| Term | Value | Note |
|---|---|---|
| P (elevation-corrected precipitation) | 2,331 mm/yr | After elevation correction |
| P_eve (event aggregate) | 1,370 mm/yr | Regression-derived |
| Q (direct runoff) | 533 mm/yr | Tertiary geology, ≤1306 mm band |
| Transpiration | 453 mm/yr | Per-tree × stem density × 12 months |
| Canopy interception | 384 mm/yr | Conifer interception rate |
| Total ET | 837 mm/yr | Transpiration + interception |
| Water yield | 961 mm/yr | 41.2% of precipitation |
5. Extending to the full AOI
Multiplying the per-hectare value by the satellite-measured forest area (12,398 ha) gives the annual water yield for the whole AOI.
6. Scale comparison
- Tokyo Dome (1.23 M m³)~97 Tokyo Domes / yr
- Household domestic use (73 m³/household)~1.63 M households / yr
- 500 ml bottled-water units~238 billion bottles / yr
- Mineral-water bottling plant capacitySeveral tens to ~100 large plants worth
7. Data sources
Open data sources (all free, commercial use OK)
- Sentinel-2 L2A (satellite imagery / NDVI) — Copernicus Data Space Ecosystem (CDSE)
- NASA POWER (monthly T & P) — power.larc.nasa.gov
- GSI Japan elevation API (DEM) — maps.gsi.go.jp
- AIST Seamless Geological Map v2 — gbank.gsj.jp/seamless/
- Forestry Agency Simplified Evaluation Method Ver.1.0 (March 2026) — rinya.maff.go.jp
8. Reducing the error envelope
- Stem density, DBH, and height use Forestry Agency standard values → integrate Forestry Agency LiDAR (Tochigi / Hyogo / Kochi already public) for 20 m mesh stand measurements, shifting to Tier 3 with ±10–15%
- Classification error from a single NDVI threshold → multi-temporal NDVI consensus to remove seasonal noise
- Coarse geology mesh (multiple classes within AOI) → per-stand subdivision to match local geology
- NASA POWER grid resolution (~50 km) → integrate AMeDAS (17 km, 10-minute resolution)
※ This report is a third-party estimate aligned with the Forestry Agency of Japan's official formula. It is not an official certification by the Forestry Agency or MAFF. Issuance of J-Credit water-yield credits requires separate official monitoring and third-party verification. All numerical values are estimates and do not constitute commercial guarantees.