1. Why "forest × TNFD" is the heaviest part of nature disclosure
TNFD (Taskforce on Nature-related Financial Disclosures) released its v1.0 recommendations in September 2023. Since 2024, it has been adopted by hundreds of multinationals, regulated funds, and ESG investors as the de facto standard for the "nature" counterpart to TCFD.
TNFD covers five realms (land, freshwater, ocean, atmosphere, biosphere), but for most companies, forest is the single heaviest realm. Three reasons:
- Water dependency. Beverage, food, semiconductor, paper, and pharma operations all depend on water, and that water depends on upstream forest water-yield. The supply chain runs through forests whether you own them or not.
- Climate dependency. Forests are the principal terrestrial CO₂ sink, so forest decline directly affects your Scope-3 offset narrative.
- Supply chain. Timber, paper, palm oil, coffee, cacao, and rubber are all forest-derived. Forest impact attaches directly to procurement.
In Japan, the Forestry Agency of Japan published Guidelines for forest-related nature disclosure in April 2025, explicitly mapping the country's forest dataset to TNFD's 14 disclosure items. This article is structured around that mapping, with global data sources substituted where readers are operating outside Japan.
2. Overview of the official guidance
The Japan guidance is helpful because it converts TNFD's 14 abstract disclosure items into specific, measurable forest functions. The same conversion table works internationally with local data swaps:
| Function category | Concrete indicator | Primary data source |
|---|---|---|
| Water yield | Annual recharge volume (mm/yr · t/yr) | Simplified water balance · satellite |
| Climate mitigation (CO₂ absorption) | Annual sequestration (t-CO₂/yr) | IPCC AFOLU Tier 2, national inventory, Sentinel-2 |
| Landslide / erosion control | Erosion-prevented volume, slope risk | DEM, precipitation |
| Biodiversity | Vegetation type, IUCN-listed species, protected-area overlap | National vegetation surveys, IUCN, KBA |
| Timber supply | Standing volume, mean annual increment (MAI) | National forest inventory, airborne LiDAR |
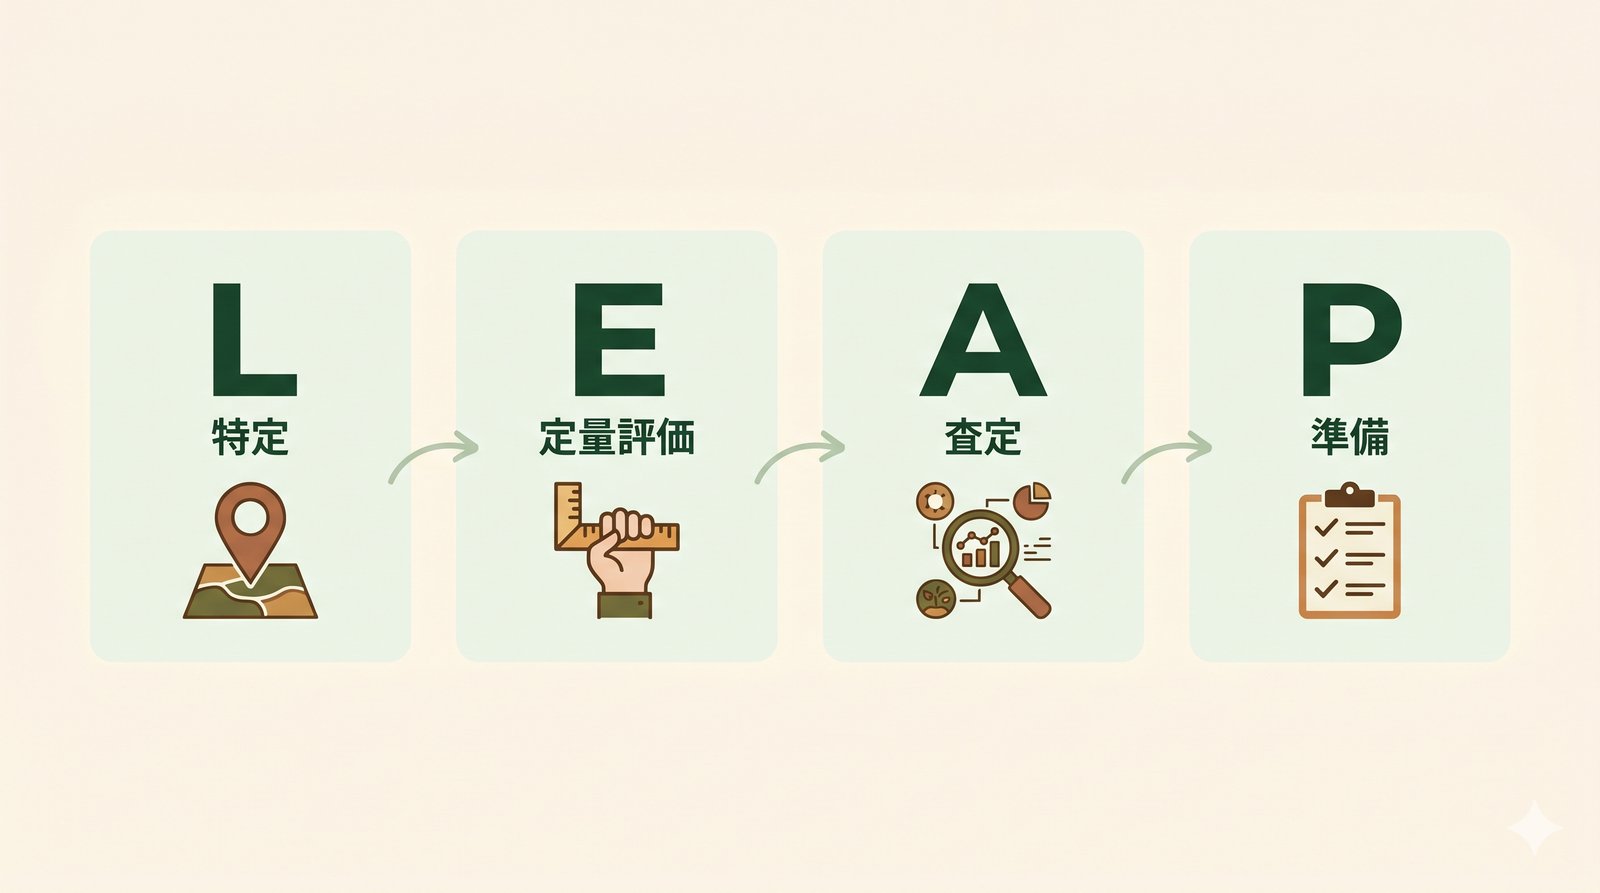
3. The LEAP approach: 4 steps for forest disclosure
TNFD recommends the LEAP approach as the implementation pattern. For forests, the same four steps apply.
4. Locate: identify your dependency forests
LEAP's first step requires geographically pinning the touchpoints between your business and nature. For forests, three categories matter most:
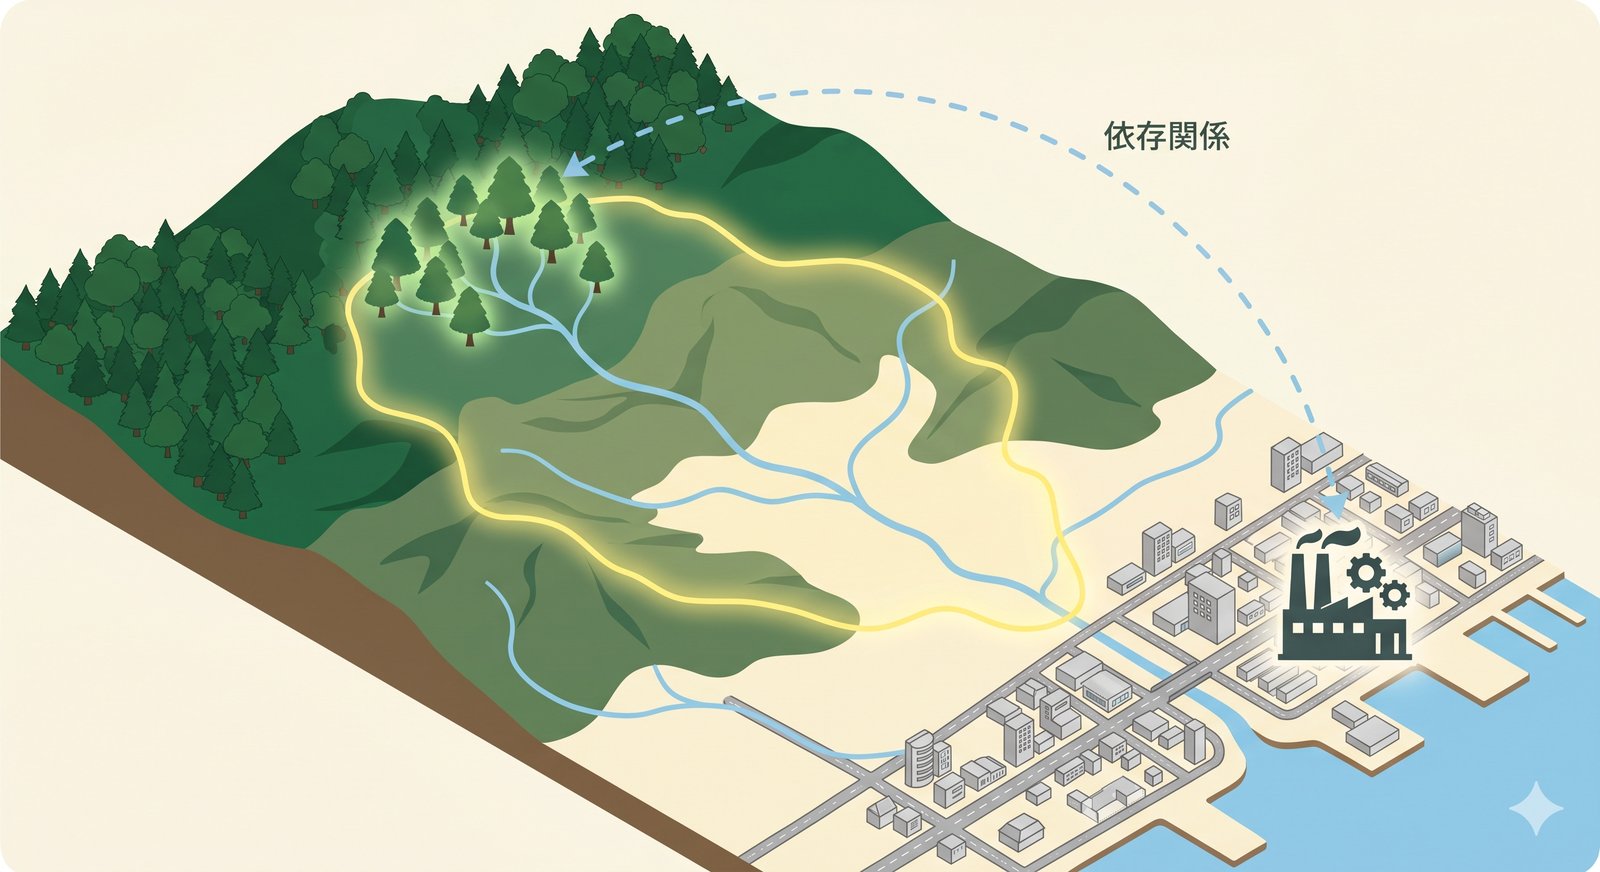
- Upstream forests of your water-intake points — the watershed feeding your factories, HQ, data centres
- Forests sourcing your raw materials — timber, paper, palm oil, soy, coffee, cacao production landscapes
- Owned / contracted forests — CSR forests, employee education sites, corporate plantations
Category 1 is the largest by volume and the hardest for companies to identify on their own. Tracing from "factory address" → "which river basin?" → "which upstream forests?" requires watershed matching: a geospatial join between an address and its catchment.
morimieru offers free watershed matching at HydroBASINS Lvl 10 resolution (global coverage, ~100 km² average basin). Enter an address and you get the catchment and upstream stands in one click — completing the Locate step for water-related forest exposure.
5. Evaluate: quantify dependency and impact
With Locate done, you quantify the magnitude. The three indicators below cover the bulk of forest-related TNFD disclosure.
5.1 Water yield
Compute annual water yield for the upstream forests of each water-intake point. Methods range from the Forestry Agency of Japan's simplified evaluation method Ver.1.0 (March 2026) to academic water-balance models. The simplified method needs only precipitation, temperature, elevation, geology, and forest area — all available globally from free sources. See our water-yield guide (JP) or the forthcoming English version for the full walkthrough.
A typical disclosure sentence: "X% of our annual water withdrawal originates from forest Y in basin Z."
5.2 CO₂ absorption
Apply IPCC AFOLU Tier 2 with national species-level coefficients. In Japan, the Forestry Agency publishes Tier 2 values per major species (sugi, hinoki, broadleaf). In India, the Forest Survey of India's regional volume tables play the same role. See the satellite × CO₂ Tier 2 article (JP) for the implementation. Sentinel-2 NDVI determines forest area; IPCC formula does the rest.
5.3 Biodiversity
Overlay national vegetation maps and IUCN Red List / Key Biodiversity Area (KBA) polygons on your located forests. In Japan, the Ministry of Environment Natural Environment Survey maps provide the vegetation layer; in India, the FSI India State of Forest Report does the same. TNFD asks you to report not only your dependency but also your impact on biodiversity — your contribution to land-use change and species risk.
6. Assess: turn quantities into risks and opportunities
Translate the magnitudes from Evaluate into financial / strategic implications.
| Category | Example forest risks and opportunities |
|---|---|
| Physical risk | Upstream forest degradation → reduced or contaminated water supply, flooding |
| Transition risk | Tightening forest-conservation regulations, investor downgrade for non-disclosure |
| Opportunity | Brand-grade forest investment, ESG-bond eligibility, supply-chain resilience |
| Systemic | Climate-driven shifts in regional hydrology that threaten the entire sector |
7. Prepare: disclosure and internal response
TNFD outputs land in your annual report, integrated report, or sustainability report. For the forest section, the guidance specifically recommends:
- Geospatial detail — the location of dependency and impact forests (at basin or stand granularity, not just country)
- Quantitative indicators — water yield, CO₂ absorption, area, vegetation type, etc.
- Change tracking — year-over-year evolution (satellite time-series differencing is ideal)
"Change tracking" is the part that TNFD will increasingly tighten as MRV (Monitoring, Reporting, Verification) standards mature. Starting the time-series record early — even before disclosure is mandatory — pays compounding returns.
8. Implementation roadmap: a 3-year plan
| Year | Milestone | How morimieru helps |
|---|---|---|
| Year 1 | Locate complete: dependency-forest registry | Watershed matching auto-generates the registry |
| Year 2 | Evaluate: first quantitative disclosure of water & CO₂ | Simplified water-balance + Tier 2 CO₂ computed end-to-end |
| Year 3 | Assess + Prepare: risk/opportunity, financial translation, annual-report disclosure | Year-over-year time-series differencing tracks change |
9. India-specific notes
For Indian companies and Indian operations of multinationals, three additional considerations:
- BRSR. SEBI's Business Responsibility and Sustainability Report already asks for water and biodiversity disclosures. TNFD-aligned forest data feeds BRSR Principle 6 directly.
- IFSCA. The International Financial Services Centres Authority is moving toward TNFD-aligned sustainability disclosure for entities in GIFT City.
- National datasets. Swap FSI for the inventory layer, IMD for the climate layer, ISRO Bhuvan / CartoSat for DEM, and India-WRIS for watershed metadata. See the India pilot article for the full mapping.
10. Frequently asked questions
- Q1. Is TNFD mandatory?
- As of mid-2026, TNFD is not legally mandatory in most jurisdictions, but it has become a practical requirement for TSE Prime / FTSE / NSE-listed companies and for funds targeted by major ESG investors. SSBJ (Japan), ISSB (global), SEBI (India BRSR), and the EU Omnibus framework are all converging on TNFD-aligned disclosure within a few years.
- Q2. Our company doesn't use much water — does forest TNFD still apply to us?
- Yes. Housing makers, printers, IT companies (paper, data-centre wood furniture), and most consumer-goods firms still procure forest-derived materials. The Japan guidance treats this as a general framework, not a water-only one.
- Q3. We don't own any forests. What do we disclose?
- Most disclosure is about dependency, not ownership. Disclose your dependency on upstream water forests and supply-chain procurement landscapes. Owning is not a prerequisite.
- Q4. Can morimieru cover the entire TNFD disclosure?
- For the quantitative data layer, mostly yes. Governance, strategy, and risk-management narrative still need to come from your team. morimieru handles Locate and the data half of Evaluate.
- Q5. What is the resolution of watershed matching?
- HydroBASINS Lvl 10 — about 100 km² mean basin area, globally. Finer resolution (national hydro datasets such as Japan KSJ W07 or India-WRIS sub-basins) is integrated where available.
11. References & sources
- Forestry Agency of Japan, Guidelines for forest-related corporate nature disclosure (April 2025)
- TNFD, Recommendations of the Taskforce on Nature-related Financial Disclosures (September 2023)
- Ministry of Environment of Japan, Natural Environment Survey
- Norinchukin Bank Executive Advisor, "Water and nature disclosure under TNFD v1.0"
- Forestry Agency of Japan, Simplified Evaluation Method for Forest Water Yield Ver.1.0 (March 2026)
- SEBI, Business Responsibility and Sustainability Reporting (BRSR) framework
- IFSCA, sustainable-finance and ESG-disclosure consultations
Last updated 2026-05-26. Based on public materials from the Forestry Agency of Japan and TNFD, organized by morimieru.