1. What forest water yield means
Forest water yield is the portion of rainfall that a forest captures in soil, releases slowly as baseflow into rivers, and ultimately delivers downstream as a reliable water supply. It is the quantitative form of the "forest as natural reservoir" idea.
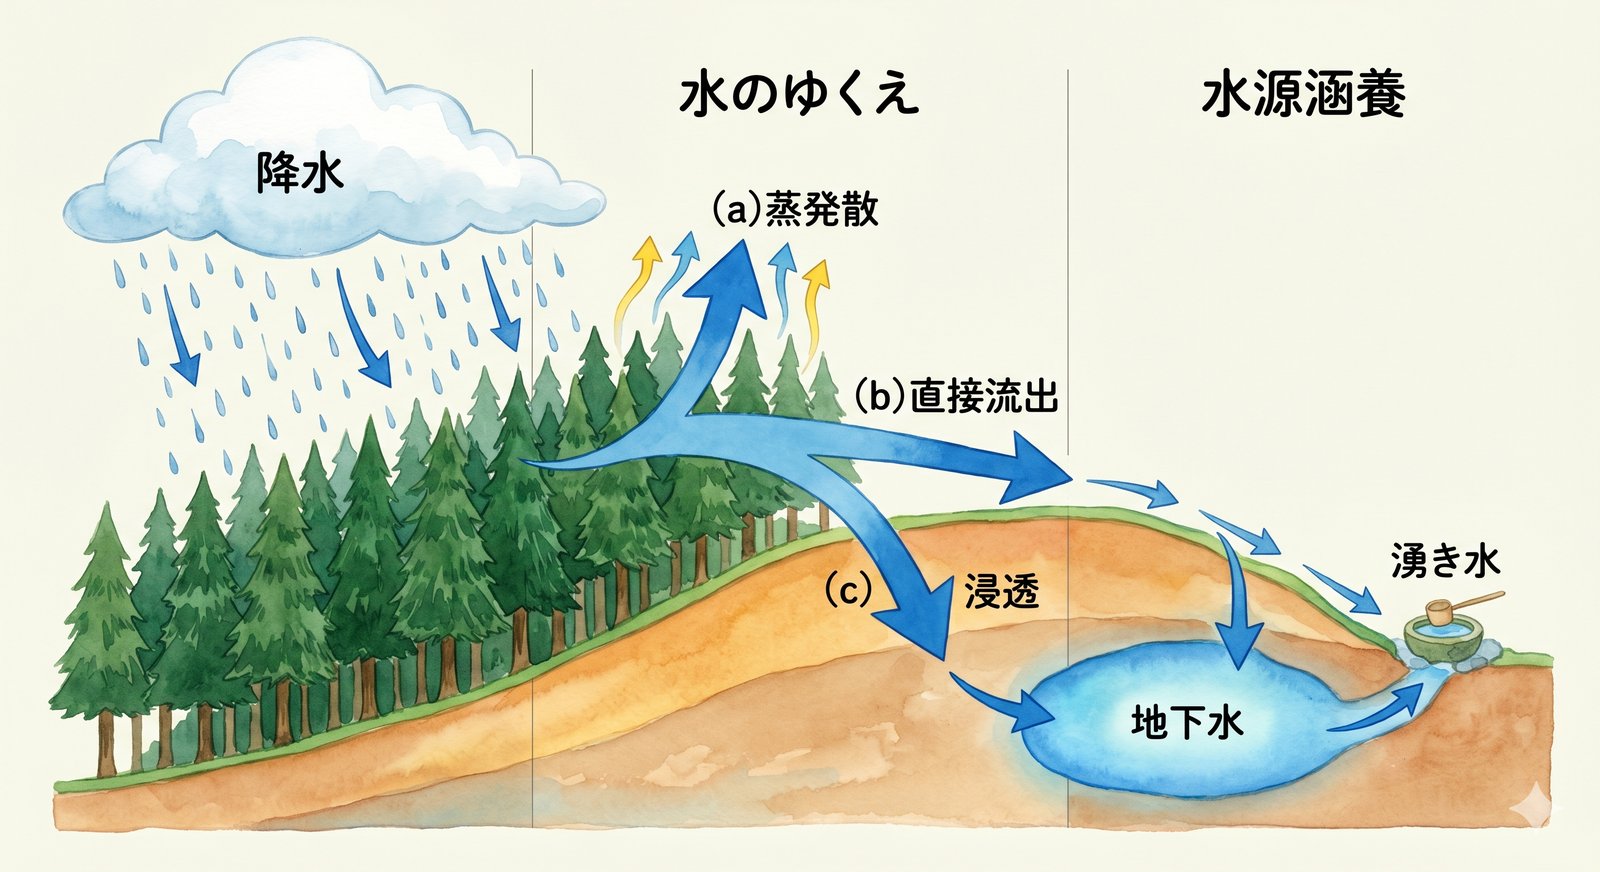
Rain that falls on a forest takes one of three routes: (a) it evaporates from the canopy, (b) it runs off the surface directly, or (c) it infiltrates into the soil and emerges over weeks to months as groundwater or baseflow. The third path is water yield. It mitigates floods and sustains rivers through dry seasons — the part of a forest that literally waters downstream cities.
2. Why measuring water yield matters now
Water yield was historically treated as a qualitative property of forests — important but hard to count. That changed in the 2020s for several reasons:
- TNFD (Taskforce on Nature-related Financial Disclosures) made watershed-level dependency disclosure a near-mandatory requirement for listed companies.
- Forest carbon credit prices crossed psychological thresholds in 2025 (¥10,000/t-CO₂ in Japan), pulling water yield in as a co-benefit narrative.
- Climate-driven flood and drought shocks make local governments accountable for explaining their forest investments to constituents.
- Water-intensive companies — beverage, food, semiconductor, paper — need to disclose their upstream-forest exposure under TNFD and BRSR (in India).
Against that backdrop, the Forestry Agency of Japan released the Simplified Evaluation Method for Forest Water Yield, Ver.1.0 in March 2026, with bilingual documentation and a downloadable spreadsheet. The method was designed so anyone could compute water yield with publicly available data.
3. How the simplified evaluation method works
The method is a standardized packaging of the textbook water-balance approach. The headline formula is simple:
3.1 The headline formula
The simplification is not in this equation — that part is decades old. It is in the standardized way to fill each term using free public data.
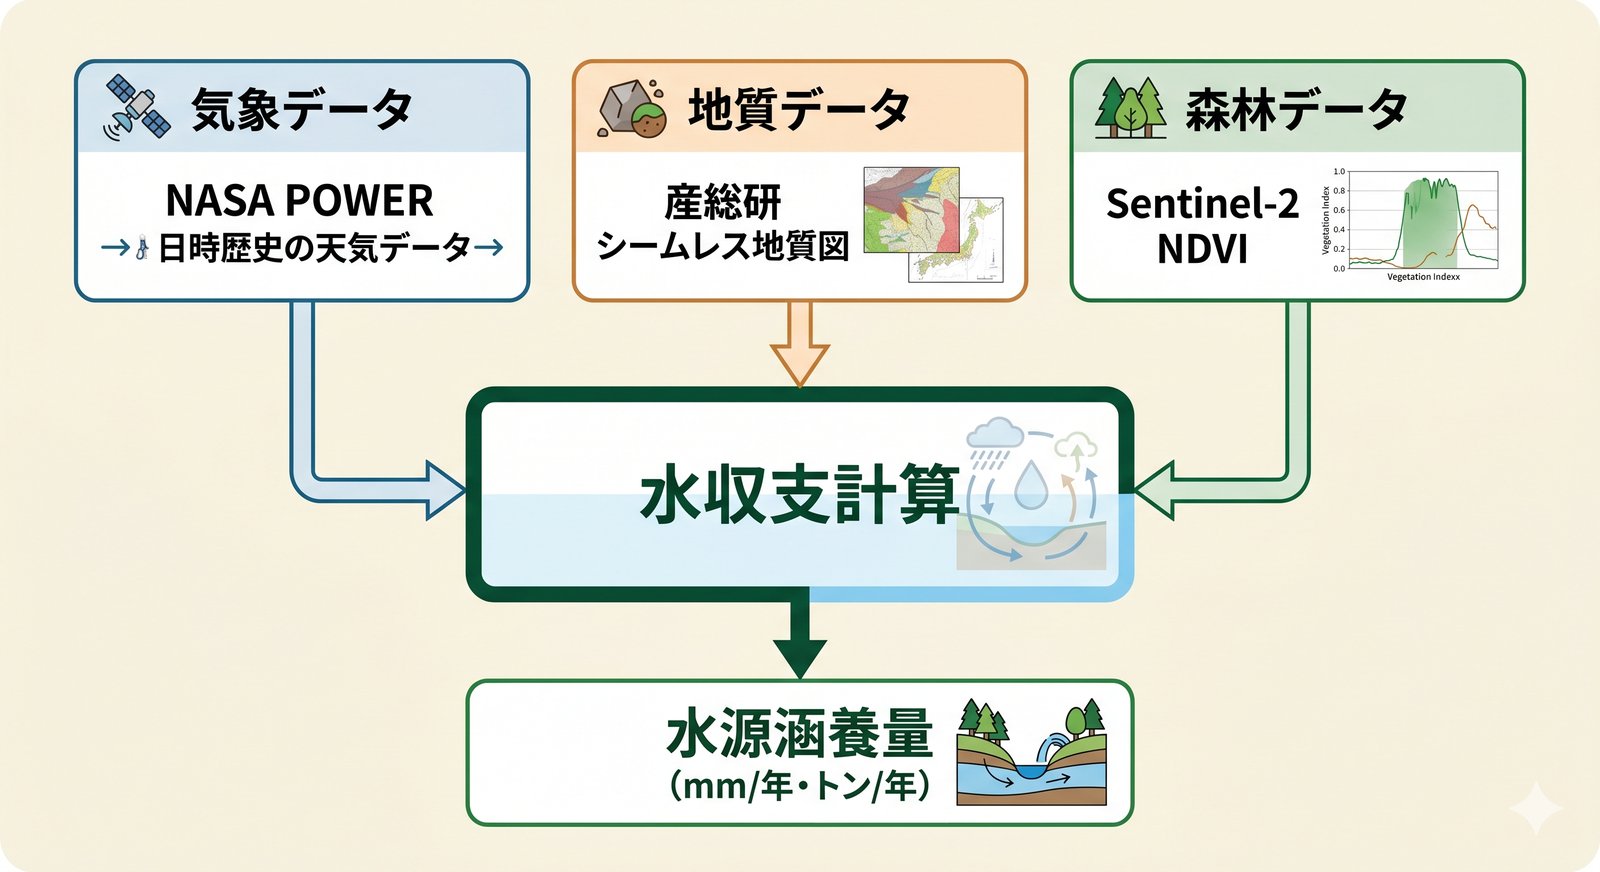
3.2 Required inputs
| Input | Open data source | Resolution |
|---|---|---|
| Precipitation | JMA AMeDAS / NASA POWER / JMA mesh climatology | 10-min to annual |
| Temperature (for ET) | JMA AMeDAS / NASA POWER | 10-min to annual |
| Geology | AIST Seamless Geological Map / GSI Japan | 20 m – 1 km mesh |
| Forest mask | KSJ A13 / Forestry Agency ledger / Sentinel-2 NDVI | 10–25 m mesh |
| Stand info (species, age) | Forest ledger / airborne LiDAR | Per stand |
All sources are free and open. For India deployments, the equivalents are: IMD (precipitation, temperature), NASA POWER (climate backup), Geological Survey of India / Bhukosh (geology), FSI / Sentinel-2 (forest), and FSI ISFR (stand info).
3.3 Calculation steps
- Precipitation. Pull 5–10 years of annual precipitation for the area and average
- Evapotranspiration. Estimate potential ET from temperature (Thornthwaite or Penman) and multiply by a land-cover coefficient
- Direct runoff rate. Apply geology-driven coefficients (Tertiary sedimentary rocks yield higher direct runoff; volcanic rocks lower)
- Forest mask. Classify pixels with NDVI ≥ 0.5 as forest (or use the national ledger / KSJ A13)
- Spatial aggregation. Sum the per-pixel balance across the forest mask
4. Worked example: Himi City, Toyama, Japan
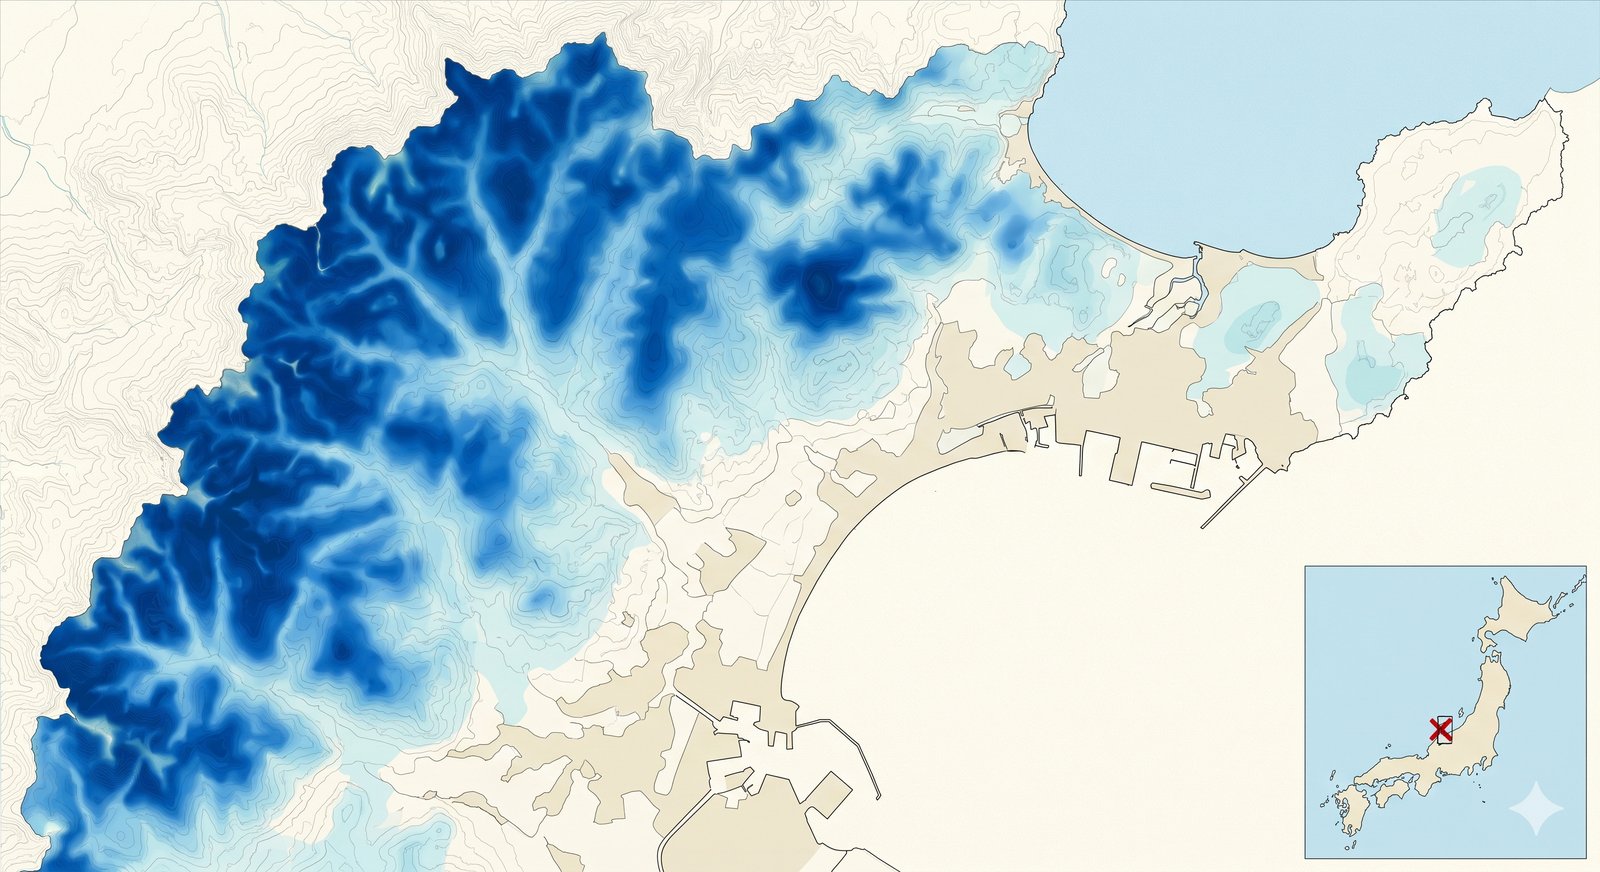
morimieru applied the method to an AOI of 16 km × 14 km around Himi City (Toyama Prefecture), covering 22,400 ha of mixed land cover. The result was ~119 million tonnes/year of water yield, or 961 mm/year over the forest area.
| Term | Value | Source |
|---|---|---|
| Annual precipitation | 2,331 mm/yr | NASA POWER 2020-2024 average |
| Evapotranspiration | 837 mm/yr | Thornthwaite method |
| Direct runoff | 533 mm/yr | Tertiary geology baseline |
| Water yield | 961 mm/yr | 41.2% of precipitation |
| Forest area | 12,398 ha | Sentinel-2 NDVI mask |
| Cross-check vs municipal record | 92% | vs Himi's reported 13,486 ha |
119 million tonnes is roughly the annual domestic water demand of 1.6 million households. The full report is at Himi water yield report (JP).
5. Three ways to run the method on your own area
A. The Forestry Agency Excel tool (simplest)
The official spreadsheet released in March 2026 lets you enter precipitation, temperature, geology composition, and forest area for a target area and outputs the standard estimate. Best for 1 ha to one stand.
B. morimieru's web interface (free, end-to-end)
Enter an address or stand ID. We auto-fetch the satellite and standard datasets and produce a report. Best for 100 ha to many tens of thousands of ha, suitable for local governments, cooperatives, and corporate ESG teams.
C. Self-implementation (research / large-scale)
Python with rasterio + pystac-client + the public datasets gives full reproducibility. We plan to open-source the morimieru pipeline. Best for nation-scale batch processing.
6. How to read the numbers
- Uncertainty ~ ±30%. Standard data only — precipitation, geology, and forest area each carry their own error, which compound
- Larger areas are more stable. Under 100 ha the noise is high; above 1,000 ha the estimate is usable
- Compare or differ, don't worship absolutes. Pre / post-management, upstream / downstream, this watershed / that watershed — these comparisons are where the signal is
- ±10–15% with LiDAR. Where national LiDAR exists (Tochigi, Hyogo, Kochi in Japan; parts of Karnataka and Uttarakhand in India), substitute it in
7. Application: TNFD, CSR, and carbon credits
Forest water yield used to fall outside formal carbon credit scope. With TNFD now requiring disclosure of corporate dependency on water provisioning, water yield has become a headline indicator for companies reporting their upstream-forest exposure.
The morimieru watershed-matching feature takes an HQ or factory address, identifies the upstream forests, and computes their water yield in one workflow — directly executing the Locate and Evaluate steps of the TNFD LEAP approach. See the TNFD forest disclosure playbook for the disclosure-side framing.
8. India-specific notes
The method transfers directly. The substitutions:
- IMD replaces JMA AMeDAS for precipitation and temperature; NASA POWER remains the global backup
- Bhukosh (GSI India) replaces AIST for geology
- Bhuvan / CartoSat (ISRO) replaces GSI Japan for DEM
- FSI ISFR replaces the Forestry Agency ledger for stand info
- India-WRIS replaces KSJ W07 for watershed metadata
The Western Ghats portion of Karnataka and Kerala typically yields 900–1,800 mm/yr of water — comparable to Japan's highest-yield basins, with much greater seasonal concentration due to the southwest monsoon. See the India pilot article for the full mapping.
9. Frequently asked questions
- Q1. Is water yield the same as storage / reservoir capacity?
- Related but distinct. Storage capacity is a stock (mm of soil water at a moment); water yield is a flow (tonnes per year). The simplified method addresses the flow.
- Q2. How does the simplified method compare with SWAT / MIKE-SHE etc.?
- SWAT and MIKE-SHE are precision hydrological models requiring expert calibration and weeks-to-months of setup. The simplified method packages a coarser version that anyone can run with public data — lower precision, dramatically lower operational cost.
- Q3. Can it quantify management effect (thinning, harvest)?
- Yes. Sentinel-2 NDVI differencing before and after management gives the change in effective forest area and stand vigour. Re-running the simplified method yields a quantified effect. See Himi monitoring report (JP).
- Q4. Is it usable for local-government accountability?
- Yes. Since the method is a publicly standardised approach from a national agency, outputs can be cited as "computed per the official Ver.1.0 method", which carries weight in council presentations and constituent briefings.
- Q5. Is morimieru free?
- Yes — fully free as public-good infrastructure. PDF reports can be downloaded for any commercial or non-commercial purpose.
10. References & sources
- Forestry Agency of Japan, Simplified Evaluation Method for Forest Water Yield Ver.1.0 (March 2026)
- Forestry Agency of Japan, Reference Materials on Forest Water Yield Functions (March 2023)
- FY2023 Mountain Conservation Survey Report (Forestry Agency, March 2024)
- NASA POWER climate data API (free, public)
- AIST Seamless Geological Map V2 (CC-BY)
- Copernicus Sentinel-2 L2A (CDSE, free, public)
- India Meteorological Department gridded products (for India deployments)
Last updated 2026-05-26. Based on public materials from the Forestry Agency of Japan, organized by morimieru.