1. The standard forest CO₂ formula
Forest CO₂ absorption is computed by the formula adopted in Japan's Forestry Agency notification (December 2021) and in IPCC AFOLU Volume 4:
Each term and a typical Japanese coefficient set:
| Term | Meaning | Sugi default | Hinoki default |
|---|---|---|---|
| Stem growth | MAI of stem volume (m³/ha/yr) | 5–8 | 3–5 |
| BEF | Biomass expansion factor (whole tree / stem) | 1.23 | 1.24 |
| Root:shoot | Belowground biomass ratio | 0.25 | 0.26 |
| Wood density | Dry density (t/m³) | 0.314 | 0.407 |
| Carbon fraction | Carbon in dry biomass | 0.51 | 0.51 |
| 44/12 | Mass conversion C → CO₂ | 3.667 | 3.667 |
A 40-year-old sugi stand of 1 ha typically yields 8–10 t-CO₂/yr as the standard reference value. India's Forest Survey of India publishes equivalent species coefficients (teak, sal, eucalyptus, mixed evergreen) that slot into the same formula.
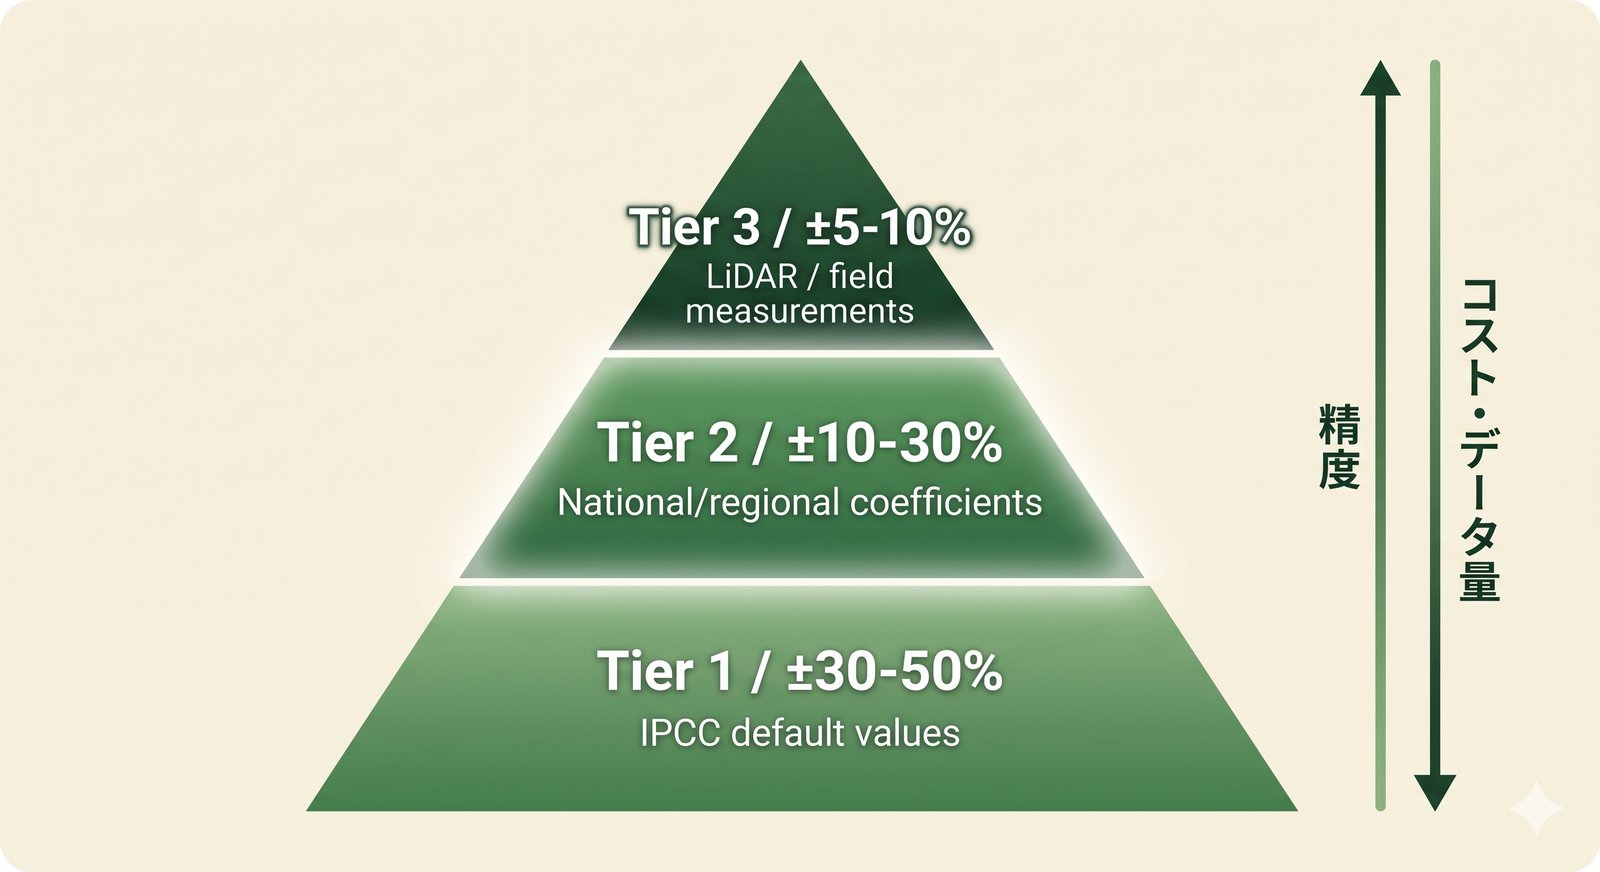
2. IPCC AFOLU Tier 1 / 2 / 3
The IPCC guidelines for the AFOLU (Agriculture, Forestry, and Other Land Use) sector define three precision levels for greenhouse-gas inventories.
Tier 1
IPCC default global values. World-average coefficients, often poorly matched to country conditions
Tier 2
Country- and region-specific coefficients by species and stand age. Japan's Forestry Agency has integrated values; FSI India is comparable. The main target of this article.
Tier 3
Stand-level measurements (LiDAR + field plots). Research labs and large SI typically
Combining Japan's forest ledger (per-stand species and age, maintained by local authorities) with the IPCC guidelines naturally lands at Tier 2.
3. Identifying forest area from Sentinel-2 NDVI
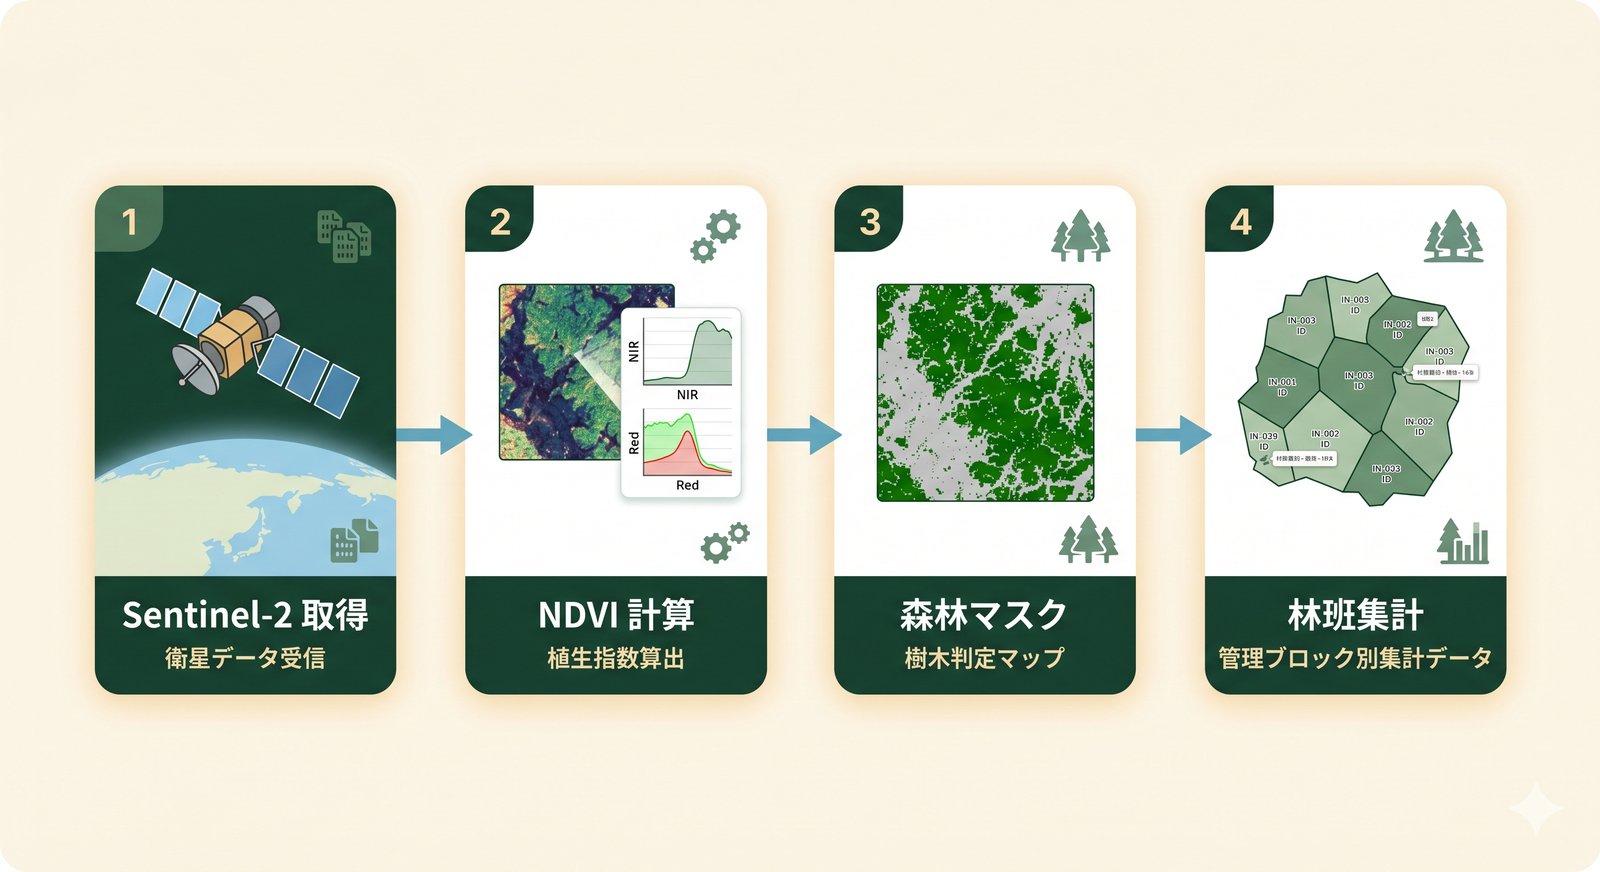
Applying the Tier 2 formula requires knowing where the forest actually is. Forest ledgers update only every decade or so and miss recent disturbance. Sentinel-2 from the European Copernicus programme is the current standard for the live answer.
NDVI ranges from −1 to +1. Healthy forest typically sits at 0.6–0.9 in the growing season. morimieru classifies pixels at NDVI ≥ 0.5 as forest, giving a per-10 m-pixel forest mask updated weekly.
4. Stand-level aggregation improves precision
Applying Tier 2 uniformly across a large AOI (say a full municipality) averages out the heterogeneity of species mix and stand age, inflating the error bar. Asako Nagano (Moriage Inc. CEO, ex-Forestry Agency of Japan Wood Utilization Division chief) flagged exactly this in our project review: "Aggregations above 100 ha get noisy."
The fix: aggregate at the forest stand (≈100 ha median in Japan). Pull species and age from the forest ledger per stand, choose Tier 2 coefficients matching that mix, then sum across the pixels Sentinel-2 actually identified as forest in that stand.
| Aggregation unit | Error target | Inputs needed |
|---|---|---|
| Municipality (~10⁴ ha) | ±30–40% | Aggregate ledger + NDVI |
| Stand (~100 ha) | ±20–30% | Per-stand ledger + NDVI |
| 20 m mesh | ±10–15% | + airborne LiDAR |
LiDAR datasets are opening up in many countries: Japan's Forestry Agency has 80%+ coverage of public forests, with three prefectures (Tochigi, Hyogo, Kochi) released to the public via the MIERUNE × Japan Forest Technology Association "Rashinban" service (CC-BY, commercial OK). India has selective coverage (Karnataka, parts of Uttarakhand). Where it exists, Tier 2 can shift toward Tier 3.
5. Worked example: Shizuoka Prefecture
morimieru has applied this pipeline to 1,102 forest stands / 161,182 ha sourced from Shizuoka Prefecture's forest cloud, computing per-stand CO₂ absorption.
| Metric | Value |
|---|---|
| Stands processed | 1,102 |
| Total forest area | 161,182 ha |
| Species mix | Sugi ≈45% · Hinoki ≈30% · Broadleaf ≈25% |
| Estimated annual absorption | ~1.3 M t-CO₂/yr |
| Median per-stand absorption | ~1,180 t-CO₂/yr |
Full report: Shizuoka forests report (JP).
6. Time-series differencing as cheap MRV
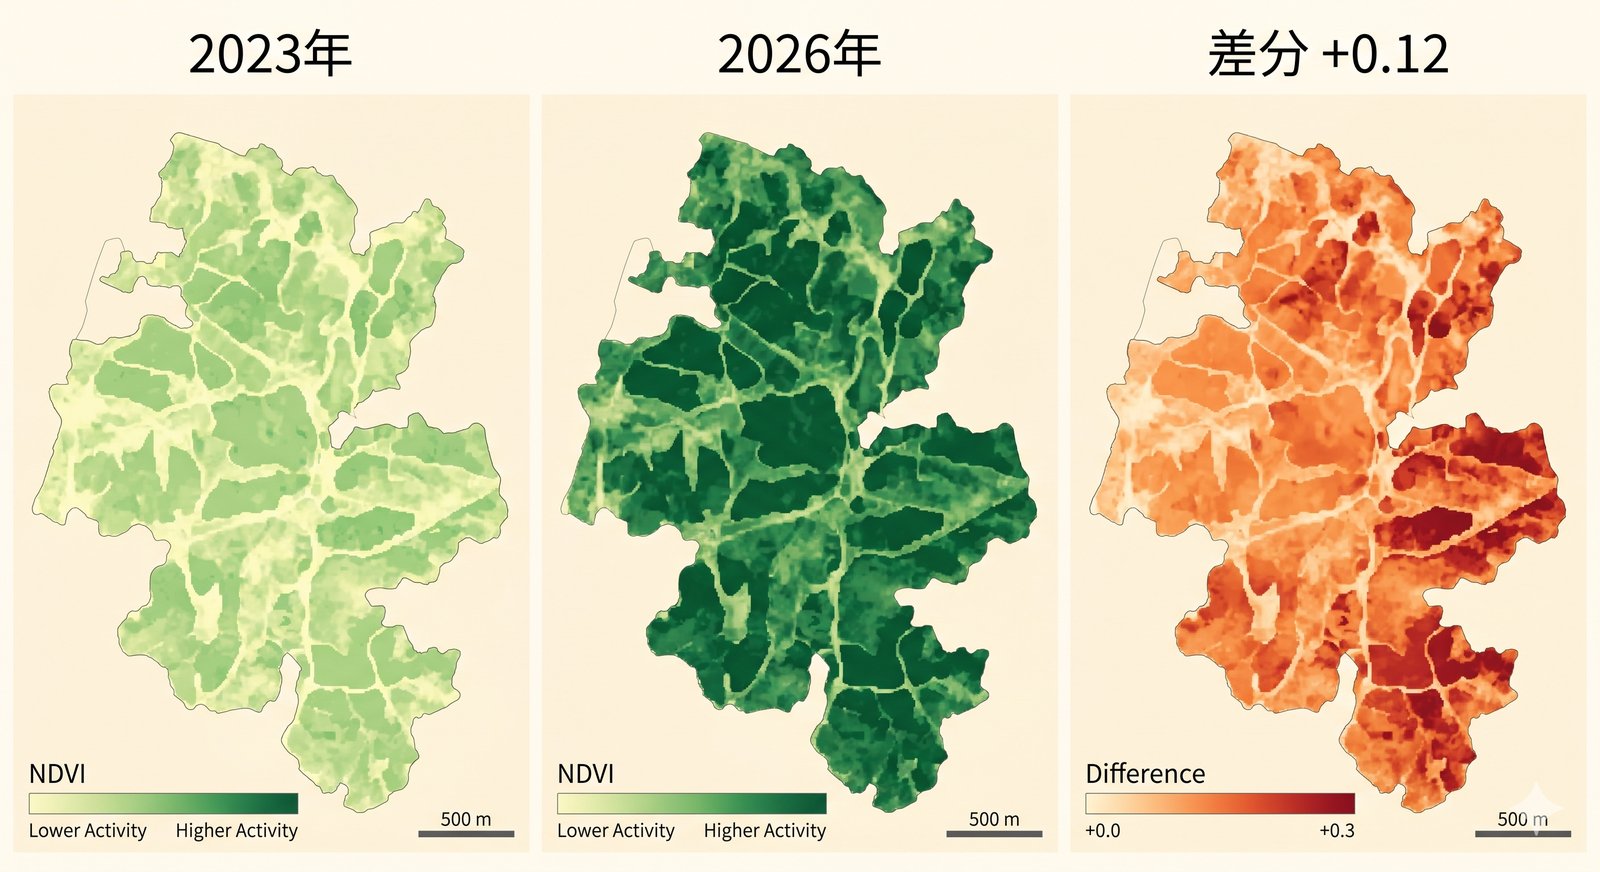
Sentinel-2 acquires every 5 days, so 5 years of NDVI history are available. The differencing of two epochs measures management effect quantitatively.
Example: "Stand X NDVI improved by 0.12 from 2023 to 2026 → an estimated +250 t-CO₂/yr absorbed." Conventional MRV via field plots or drone surveys runs hundreds of thousands to millions of yen per project. Satellite differencing brings the same MRV signal down to roughly 10,000 yen/yr per project — a 100× cost compression.
7. Implementation stack
morimieru's complete stack is open-source and free-tier:
| Layer | Technology | License |
|---|---|---|
| Satellite acquisition | Copernicus CDSE (pystac-client) | Free, commercial OK |
| NDVI calculation | Python (rasterio + numpy) | OSS |
| Stand polygons | Shizuoka forest cloud vector tiles | Open data |
| Species coefficients | Forestry Agency of Japan standard values | Public |
| Map rendering | Leaflet + Esri World Imagery | Free tier |
| Cryptographic verification | TPM 2.0 attestation + Merkle hash | Open spec |
8. Limitations and roadmap
- Cloud cover. Sentinel-2 is optical, so the monsoon and rainy seasons produce gaps. Multi-temporal compositing reduces but does not eliminate them.
- Species discrimination. NDVI alone cannot reliably tell sugi from hinoki from broadleaf. Integration with the forest ledger compensates.
- Stand-volume model limits. The mean annual increment strongly depends on age and site quality; standard values capture only national averages.
- Roadmap. Sentinel-1 SAR for cloud penetration; machine-learning forest classification trained on Sentinel-2 + forest ledger.
9. India-specific notes
For Indian deployments, three substitutions:
- FSI inventory replaces the Forestry Agency of Japan dataset as the species- and age-coefficient source.
- Bhuvan / CartoSat (ISRO) replaces GSI elevation API for DEM.
- CCTS afforestation methodology replaces J-Credit FO-001/002/003 for credit issuance. See the India pilot article.
Western Ghats evergreen and semi-evergreen stands typically deliver 15–22 t-CO₂/ha/yr under Tier 2 — higher than Japan's sugi defaults thanks to year-round photosynthesis and faster turnover.
10. Frequently asked questions
- Q1. Can satellites discriminate tree species?
- Sentinel-2 alone cannot reliably do fine species discrimination. Broad classes (conifer / broadleaf, evergreen / deciduous) are tractable from spectral signature, but sugi vs. hinoki vs. larch needs machine learning trained on the forest ledger as a label source.
- Q2. How different are Tier 1 and Tier 2 results?
- For a 100 ha sugi stand, Tier 1 (IPCC defaults) gives roughly 6 t-CO₂/ha/yr, Tier 2 (Japan-specific values) 8–10 t-CO₂/ha/yr. Japan's plantation forests are unusually productive, so Tier 1 systematically underestimates.
- Q3. Does the method work with international standards (VCS, Gold Standard)?
- Yes — Tier 2 is the standard backbone of both VCS and Gold Standard methodologies. Each standard adds requirements (baseline definition, additionality, leakage), so MRV design must be tailored per standard.
- Q4. Can morimieru numbers be used directly for J-Credit / CCTS applications?
- Not directly — each programme requires pre-approved methodologies and monitoring plans registered through their official process. morimieru numbers are useful as supporting evidence and as ongoing MRV alongside the registered methodology.
- Q5. Is the computation code public?
- An open-source release is on the roadmap. The Python pipeline (rasterio + pystac-client + numpy) is small enough that we will publish it in stages once we lock the API.
11. References & sources
- IPCC, 2006 IPCC Guidelines for National Greenhouse Gas Inventories, AFOLU Volume 4 (2019 Refinement)
- Forestry Agency of Japan, Method for estimating forest CO₂ absorption (December 2021 notification)
- Copernicus Sentinel-2 L2A product specification
- Shizuoka Prefecture forest cloud (stand vector tiles)
- MIERUNE × Japan Forest Technology Association, Rashinban (Tochigi / Hyogo / Kochi LiDAR data)
- Forest Survey of India, India State of Forest Report
Last updated 2026-05-26. Based on IPCC guidelines and public materials, organized by morimieru.